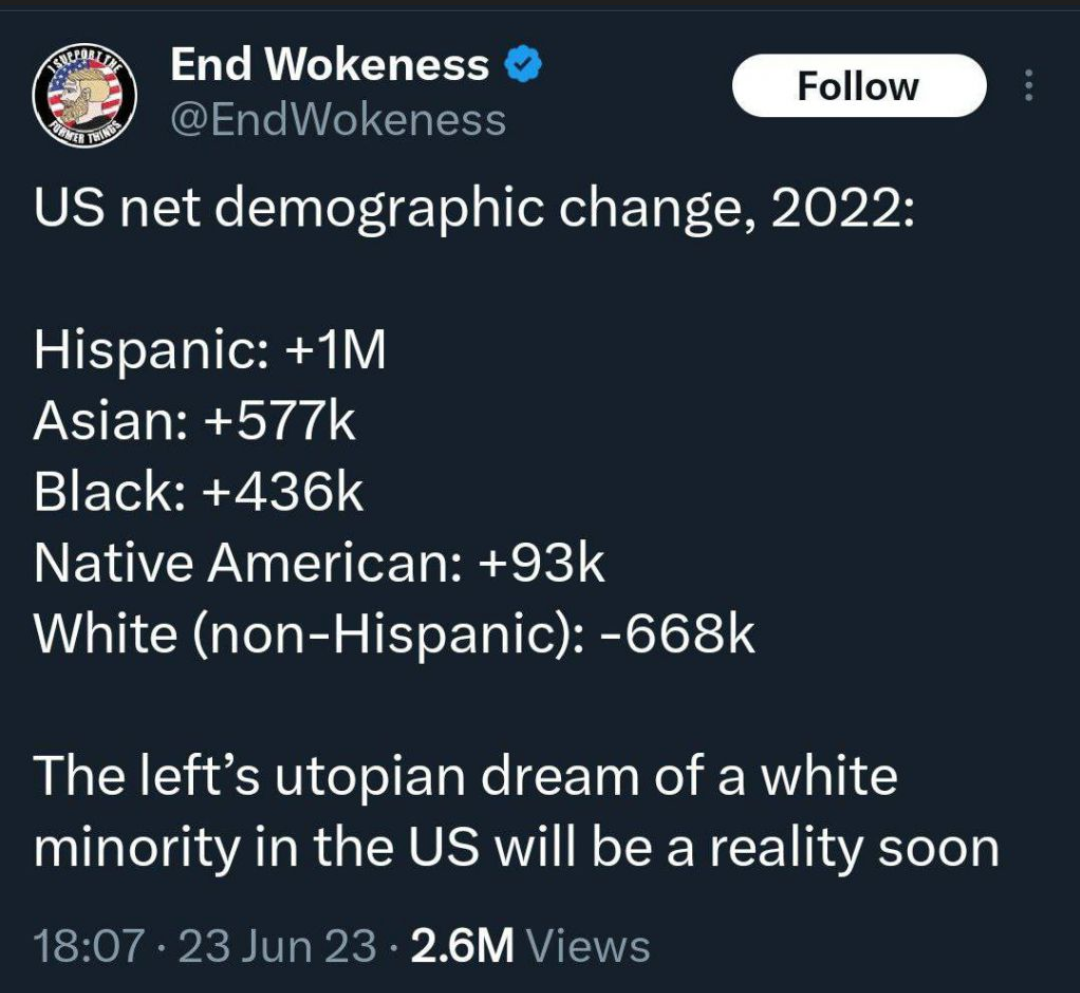
no source. Probably US census data though, in which case they didn't read it right. Whites actually had a net positive. The negative number is a "group" of mixed they took OUT of the white count, thus it shows a negative number.
Now check this page out. https://www.census.gov/library/visualizations/interactive/race-and-ethnicity-in-the-united-state-2010-and-2020-census.html click "How each group has changed from 2010." White alone -8.6% white in combination 315.8% White alone or in combination 1.9%. ... 315% increase? No those "combination whites" haven't been breeding like rabbits my friend! They are just counted/processed differently in the census. Gee I wonder which group count they got pulled from... The average of the 2 groups is closer to the real number, which is a net positive. According to census data totals, it's +3.6% for Whites, not negative 8.6%
also "white in combination" total numbers for comparison: 2000:5,470,349; 2010:7,487,133; 2020;31,100,000
TLDR: It seems that Whites increased somewhere around the range of +2 to +3%. Impossible to know for sure because they changed the way they counted the census and did not include any details on how exactly.
[ + ] eongoat
[ - ] eongoat 2 points 10 monthsAug 14, 2024 21:17:56 ago (+2/-0)
[ + ] SecretHitler
[ - ] SecretHitler 1 point 10 monthsAug 15, 2024 02:11:36 ago (+1/-0)
[ + ] eongoat
[ - ] eongoat 1 point 10 monthsAug 18, 2024 12:32:02 ago (+1/-0)
https://www.census.gov/content/dam/Census/library/publications/2011/dec/c2010br-05.pdf
from 2000 to 2010 Whites or people that identified only as White went from 194,552,774 to 196,817,552 (table 3) or increase of 2,264,778 or 1.15% (I didn't include hispanics).
https://www.census.gov/content/dam/Census/newsroom/press-kits/2021/redistricting/20210812-presentation-redistricting-jones.pdf
from 2010 to 2020 data: Whites only went from 196,817,552 to 204.3M (pg 8) +3.6% (7,482,448) increase. But they also changed how they counted, etc. see Pg 4. So because of "the mystery changes" a group got removed from the Whites only category and then said oh look -668k.
side note: also look at Page 34.
Now check this page out.
https://www.census.gov/library/visualizations/interactive/race-and-ethnicity-in-the-united-state-2010-and-2020-census.html
click "How each group has changed from 2010."
White alone -8.6%
white in combination 315.8%
White alone or in combination 1.9%.
... 315% increase? No those "combination whites" haven't been breeding like rabbits my friend! They are just counted/processed differently in the census. Gee I wonder which group count they got pulled from... The average of the 2 groups is closer to the real number, which is a net positive. According to census data totals, it's +3.6% for Whites, not negative 8.6%
also "white in combination" total numbers for comparison: 2000:5,470,349; 2010:7,487,133; 2020;31,100,000
TLDR: It seems that Whites increased somewhere around the range of +2 to +3%. Impossible to know for sure because they changed the way they counted the census and did not include any details on how exactly.
[ + ] Trope
[ - ] Trope 1 point 10 monthsAug 14, 2024 21:47:26 ago (+1/-0)
[ + ] ModernGuilt
[ - ] ModernGuilt 0 points 10 monthsAug 15, 2024 07:57:50 ago (+0/-0)
[ + ] boekanier
[ - ] boekanier 0 points 10 monthsAug 15, 2024 02:24:08 ago (+0/-0)
[ + ] Prairie
[ - ] Prairie 0 points 10 monthsAug 14, 2024 23:54:36 ago (+0/-0)
Only 1M? I'm not buying it.