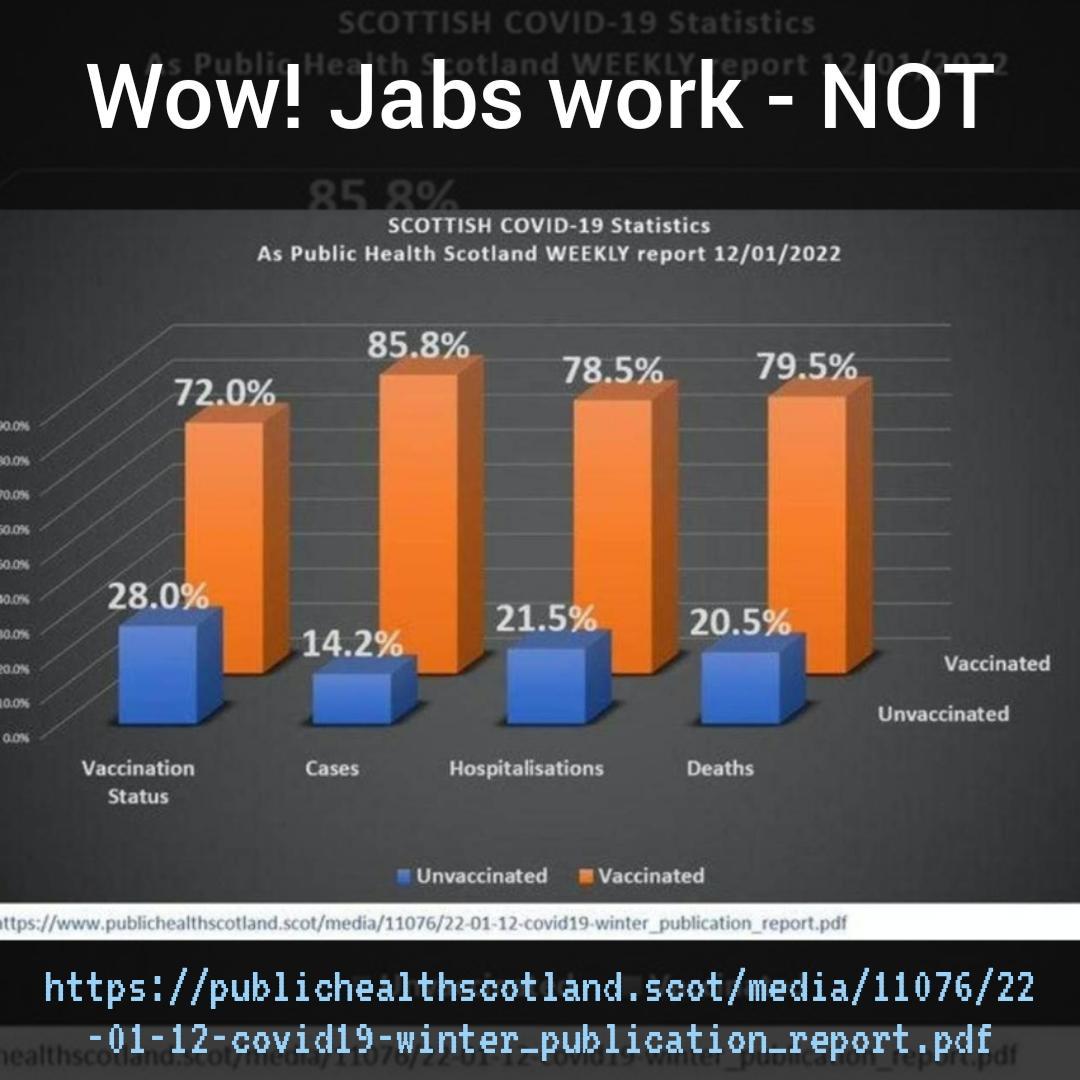
There doesn't have to be a lot of skew from randomness to give the variations shown. The most variant one is about 20% higher than the unjabbed. You'd expect all the old people to be jabbed, and the unjabbed to be mostly young people, at a lower risk. Top and bottom 20%.
What the graph does show is that the vaxx, it does (little to) nothing.
[ + ] 2017Fallout
[ - ] 2017Fallout 0 points 3.2 yearsFeb 24, 2022 16:52:52 ago (+0/-0)
[ + ] Prairie
[ - ] Prairie 2 points 3.2 yearsFeb 24, 2022 15:07:03 ago (+2/-0)
[ + ] account deleted by user
[ - ] account deleted by user 1 point 3.2 yearsFeb 24, 2022 23:15:15 ago (+1/-0)
[ + ] Belrick
[ - ] Belrick 0 points 3.2 yearsFeb 24, 2022 16:59:48 ago (+0/-0)
[ + ] Prairie
[ - ] Prairie 0 points 3.2 yearsFeb 25, 2022 02:55:56 ago (+0/-0)
What the graph does show is that the vaxx, it does (little to) nothing.
[ + ] SilentByAssociation
[ - ] SilentByAssociation 0 points 3.2 yearsFeb 24, 2022 13:42:50 ago (+0/-0)
[ + ] VitaminSieg
[ - ] VitaminSieg 0 points 3.2 yearsFeb 24, 2022 12:51:53 ago (+0/-0)